Wealth, Inequality and Capitalism: Rethinking Economic Models for Inclusion
Capitalism is praised for its ability to generate economic growth, create innovation and promote entrepreneurship. In this article, we discuss a different perspective and analyse some of the negative impacts of capitalism as an economic model.
Despite the critique that might resonate through the article, we as human beings are still yet to find a better economic model to foster innovation and entrepreneurship. In fact, recent attempts to do so have resulted in totalitarianism and poverty, best summarised in a quote from Ray Dalio:
The problem is that capitalists don’t know how to divide the pie well. Socialists don’t know how to grow it well.
The inability of capitalists to divide the pie creates severe income disparities, with wealth concentrated in the hands of a few. As a result, capitalism excludes certain individuals or groups by limiting access to opportunities and resources. By doing so, capitalism hinders the growth and well-being of society as a whole.
We start by understanding the nature of the problem and examine how high income inequality reinforces the social immobility loop for poor people. We then turn towards analysing the different income streams and the access to financial instruments that enable income generation via capital gains. We conclude with a take-away on how access to such instruments is very limited.
The follow-ups for the article take a more constructive approach and outline a proposal for levelling the playing field.
Wealth concentration – negative impacts
While we discuss income inequality at length in the article, we need to understand that income inequality is part of human society. As long as human beings are born with different skills and intelligence levels, we continue to have different odds. We are not born equal; however, we should ensure that everyone gets their fair chance.
Income inequality creates lifelong barriers that are passed on from one generation to the next. Unemployment and low incomes create an environment in which children are unable to focus on education and they limit access to healthcare and basic necessities, such as safe housing, clean water or proper sewage.
Ultimately, income inequality is a major cause of social tensions, dividing entire nations. As a result, riots and clashes that further impede society become increasingly likely. The Arab Spring is one of many examples of how revolts can start due to a lack of opportunities in society.
Another way to understand the impact of high income disparities is through the lens of innovation. Innovation is one of the main driving forces behind the improvement of our society. However, if a potential new Einstein is stuck in poverty, they might never escape from behind the patent desk in order to feed their family.
Connecting the dots: GINI index and intergenerational mobility
Social mobility refers to the movement of individuals in social positions over time. Absolute mobility measures the extent to which living standards in a society have increased and is often measured by what percentage of people have higher incomes than their parents. Relative mobility refers to how likely children are to move from their parents’ position in the social hierarchy.
In this article we mainly focus on relative social mobility and we uncover how good the chances are of children to climb in the social hierarchy independent of their parent’s status or wealth.
Social mobility is often approximated by looking at the measure of intergenerational income elasticity, which reflects the odds of a change in the status of family members between generations. This change can either be in achieving a higher social status than the previous generation or dropping to a lower social status than the previous generation.
If the intergenerational income elasticity is equal to zero, then there is no relationship between family background and the adult income outcomes of children. A child born into poverty would have exactly the same chances of earning a high income as a child born into a rich family. At the other extreme, if intergenerational income elasticity is equal to 1, all poor children would become poor adults and all rich children would become rich adults.
In countries with high levels of relative income mobility, there is still a (relatively) small advantage to being born into a high-income family. In Denmark or Finland, for example, if a parent earns 100% more than another, it is estimated that the impact on a child’s future income is around 15%, compared to about 50% in the United States and 60% in China.
The practical manifestation of this likelihood is the number of generations it takes for someone from a low-income family to move up to a middle-income family. In Denmark, it would require two generations, in the US six and in South Africa or Brazil you would face a staggering nine generations to get out of poverty.
Now it is time to take a look at the Global Social Mobility Index, published by the World Economic Forum. The index is composed of several components, such as technology & education access, health and fair working opportunities. In simple terms, it expresses the relationship between generations and exposes the correlation of the social and economic status of an individual relative to their parents.
| Most Social Mobility | Least Social Mobility |
|---|---|
| Denmark | Ivory Coast |
| Norway | Senegal |
| Finland | Cameroon |
| Sweden | Pakistan |
| Iceland | Bangladesh |
| Netherlands | South Africa |
| Switzerland | India |
| Belgium | Guatemala |
| Austria | Honduras |
| Luxembourg | Morocco |
We will couple this data with the GINI index, which is used to measure income (in)equality and rate each country with a GINI coefficient from zero to one. A Gini coefficient of 0 reflects perfect equality, where all income or wealth values are the same, while a Gini coefficient of 1 reflects maximal inequality among values, for example a single individual having all the income while all others have none:
| Least Income Inequality | Most Income Inequality |
|---|---|
| Slovenia | South Africa |
| Czech Republic | Namibia |
| Slovakia | Suriname |
| Belarus | Zambia |
| Moldova | Central African Republic |
| United Arab Emirates | Eswatini |
| Iceland | Colombia |
| Azerbaijan | Mozambique |
| Ukraine | Hong Kong |
| Belgium | Botswana |
Now, if we conduct Pearson Correlation Coefficient analysis on the Social Mobility Index in comparison to the GINI Index, we unsurprisingly find a strong correlation between the two. For the 82 countries the Social Mobility Index and GINI index are available for, we find the Pearson correlation coefficient of -0.53, which indicates a strong correlation between countries with less income inequality and greater social mobility:
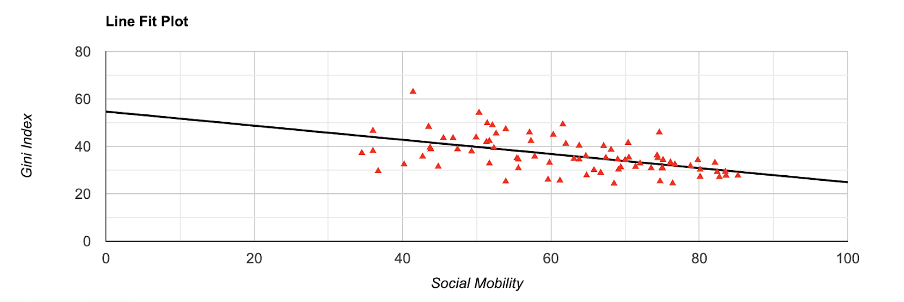
Correlation between social mobility and income inequality
The implication of such a correlation means that being born in a poor family in Denmark gives you decent odds at breaking out of the health/education/income trap. However, if you are born poor in Peru, the chances of you or your great-great-great-grandchildren climbing in social status are not to be envied:
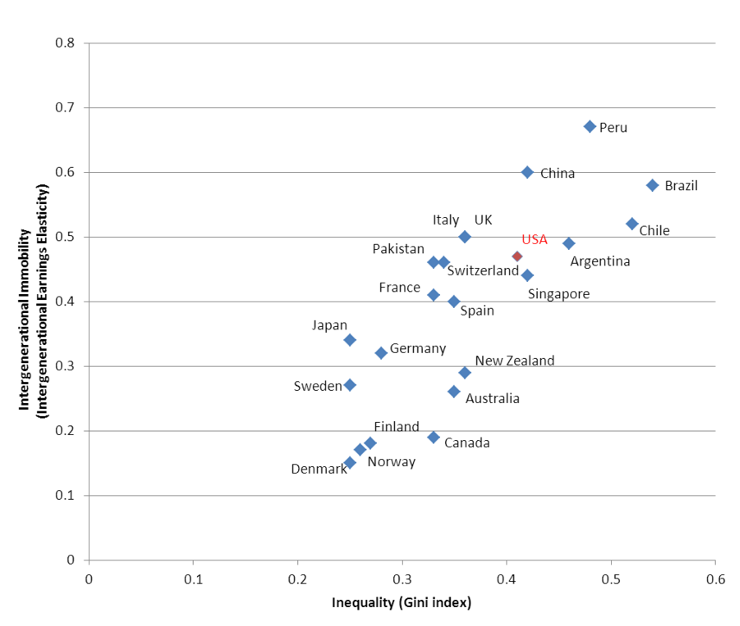
Correlation between intergenerational mobility and income inequality
High income inequality - a barrier on social mobility
The studies demonstrate the clear correlation between low social mobility and high income inequality. Even more so, correlations with income inequality and other factors have also been investigated. As such studies demonstrate, a weak to medium to strong correlation exists between innovation, democracy, the maternal mortality ratio, low birthweight babies, the human development index and other variables.
All in all, it seems that income inequality manifests in society in multiple ways. And in most cases, the correlation is negative, indicating that greater income inequality damages the fabric of our society.
The World Economic Forum report supports our claims in demonstrating the self-reinforcing loop between economic inequality and the foundational pillars of our society. Whether it is education, innovation, health, social mobility or democracy, high income disparity harms the very foundation of our modern world.
Why is this dangerous? Quoting famous hedge fund manager Ray Dalio from his post from 2019:
In addition to social and economic bad consequences, the income/wealth/opportunity gap is leading to dangerous social and political divisions that threaten our cohesive fabric and capitalism itself. I believe that, as a principle, if there is a very big gap in the economic conditions of people who share a budget and there is an economic downturn, there is a high risk of bad conflict.
A decade-old warning of “pitchforks are coming” from another billionaire Nick Hauer paints an even grimmer picture:
If we don’t do something to fix the glaring inequities in this economy, the pitchforks are going to come for us. No society can sustain this kind of rising inequality. In fact, there is no example in human history where wealth accumulated like this and the pitchforks didn’t eventually come out. You show me a highly unequal society, and I will show you a police state. Or an uprising. There are no counterexamples. None. It’s not if, it’s when.
With this understanding, it is time to look into income itself. Where does one even get the income?
Understanding income sources - labour vs capital
Leaving aside truly exotic income streams (like winning the lottery) and social welfare programmes, income is earned by utilising one’s labour or by deploying the accumulated capital.
Capital can generate income through various means - from loan interest, to dividends from investments to rent from real estate. All such means are essentially just financial instruments, which carry an investment risk and offer a return against taking such a risk.
Labour also earns income through a financial instrument. This instrument is called salary, and it is in essence a debt instrument where the employer promises to pay the employee every month against the services provided during the month.
Most people only have access to a single financial instrument in their lifetime - salary. As a result, most people are not able to enjoy the benefits that capital income streams can offer:
- Passive income. Capital income can be earned without active involvement in day-to-day operations. For example, dividends from stocks, interest from bonds or rental income from properties can be earned when not actively working, thereby providing the potential to earn money while enjoying free time.
- Accumulation. Compounding interests that get reinvested coupled with the appreciation of assets builds the basis of capital accumulation where having money just lures in more money.
- Diversification. Capital can be invested into different instruments, in turn reducing the risk to a particular region/sector. As a result, capital income streams can be more resilient to economic downturns.
- Tax advantages. Capital income can be subject to different tax treatment compared to labour income. For example, long-term capital gains on investments held over multiple years may be taxed at a lower rate than labour income.
Ultimately, if a person is basing their income stream on revenue alone, he/she is:
- Forced to actively participate in the labour force, losing access to any income as soon as their participation stops.
- Not able to accumulate investments. This is only partially true; if you invest in your skillset as an employee, you are likely to enjoy a higher salary, but it is still a significant disadvantage compared to the compounding nature of capital
- Taking on all the risks related to the geography/sector his/her employer is residing in. If the real estate sector takes a hit in a country, many people employed in that sector will find themselves out of income
- Typically paying higher taxes on their labour than on potential capital income, which, ultimately, adds insult to injury.
As outlined above, capital as a source for income seems to be both more effective and more resilient in comparison to labour.
Declining share of labour in income
Labour’s share of income has been declining in developed and, to a lesser extent, emerging markets since the 1980s. Acording to a report from the International Monetary Fund (IMF) in 2017, the share of labour in income in 35 advanced economies fell on average from 54 percent in 1980 to 50.5 percent in 2014.
The change is not uniform and different countries have experienced different trends, as McKinsey study from 2019 demonstrates:
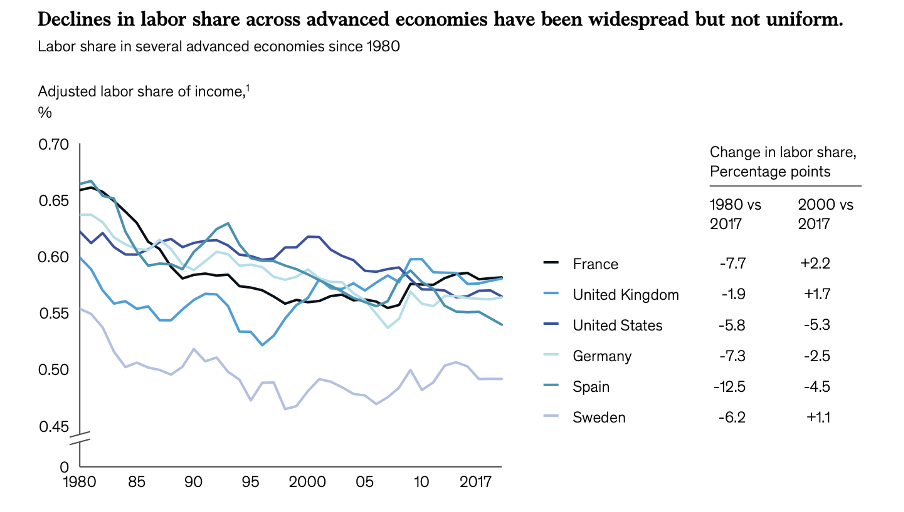
This trend is even more interesting (or worrying) if we zoom into the largest economy in the world:
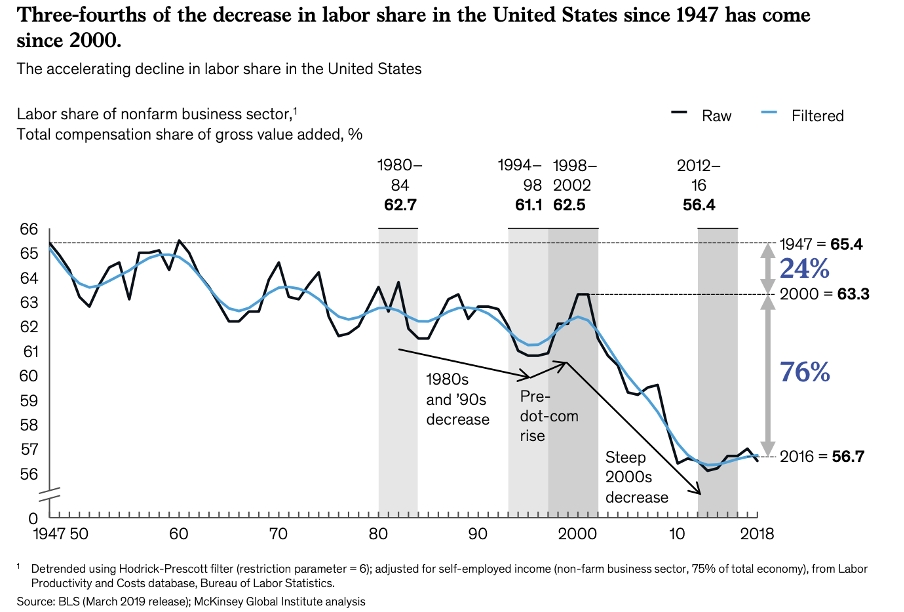
The United States has faced an unprecedented decline in the labour share of income in the 2000s, dropping from 63.3% in 2000 to 56.7% in 2010.
Global trends
There are multiple reasons for the drop in labour share in income in developed countries. The most important contributors are
- New technologies. Automation and technology have both increased productivity and reduced the demand for certain labour. Machines and algorithms are increasingly replacing tasks previously performed by human workers. And this is even before AI really steps into the game
- Globalisation and consolidation. Tearing down trade barriers has resulted in global market winners replacing local market leaders, thereby consolidating capital gains to market leader shareholders. In addition, companies seeking cheaper labour have been moving jobs overseas, putting pressure on domestic wages.
- Weakening of labour unions. Entire new sectors have been founded with no labour unions - for example, platform workers are entirely without union support. This has weakened workers’ bargaining power, making it harder to negotiate for higher wages or benefits.
- The shift to service economy. Developed economies have transitioned from manufacturing-based to service-based economies. Service jobs often pay less than manufacturing jobs.
If anything, these trends are picking up pace and creating the foundation for a perfect storm forming around increasing income inequality.
Asset classes
As discussed in previous chapters - the benefits of capital gains as well as global trends clearly support the thesis that every rational individual should start thinking about accumulating capital and investing it into the financial instrument that best suits their risk profile.
As a retail investor, you have access to most asset classes for investment purposes - be it bonds, stock or real estate - the choice seems overwhelming. (Toxic) Derivatives aside, a retail investor has seemingly endless opportunities. But does he?
Assets for investments traditionally include stocks, bonds and real estate. Over the years, money market/hedge/venture/mutual funds, cash equivalents, cryptocurrencies, commodities and derivatives (options/futures/CFDs) have been added to the mix.
In this article we focus only on stocks and real estate, and bypass others for different reasons:
- Bonds have (especially since the 1960s) been vastly inferior in the rate of return in comparison to stocks. If we look at the period since the great depression, stock market returns in the US have been double the bond returns. Bonds are especially weak during periods of high inflation, and with all the recent money printing, the future for long-term bond investments does not look appealing.
- Cash equivalents (such as through money market funds) face an even worse rate of return and also pose accessibility problems
- Hedge/Venture/Mutual funds are effectively just wrappers around the underlying instrument itself, adding convenience and hedging in return for management fees.
- Commodities by nature do not generate any income - owning oil/aluminium/gold does not generate cash flow in the same way that businesses or bonds do. This still leaves them with a role in investment strategy, but they should not be the cornerstone of your investment portfolio.
- Last but not least, cryptocurrencies and derivatives bear too much of a risk to really be considered as the foundation of anyone’s investment strategy.
Capital needs
Let’s start with a real estate investment example: even with leverage, you just cannot add this asset class without at least several tens of thousands of euros of available capital. As an example, most people in their twenties are almost automatically excluded - they just haven’t turned enough labour into capital just yet.
When we look at publicly traded stocks, the picture looks different - you can start investing in stocks with just a few hundred euros. So seemingly no barriers, right? Again - the reality might paint a different picture when we look at the capital needs:
- Average income in Estonia (an EU country where the author is from) is 1,741 EUR/mo (20,892 EUR/yr) at the time of writing (2023 Q2).
- Average pension in Estonia is 700 EUR/mo (8,400 EUR/yr).
Now, let’s assume the average person who is retiring wishes to maintain their lifestyle. As a result, he should have accumulated enough capital to cover 1,041 EUR/mo (~12,492 EUR/yr) delta between the two.
- Let’s simplify, and say our average person picks an average stock from the S&P 500 (after all, he is average, isn’t he?). Average return for S&P 500 from its introduction in 1957, adjusted for inflation is 8.5%
- To be able to withdraw 12,492/yr without impacting the base working capital, the total accumulated capital must be 146,964 EUR.
The following illustrates the pace at which the required capital can be accumulated, given different savings levels:
| Savings per Month | Years Required |
|---|---|
| 50 EUR | 38 |
| 100 EUR | 30 |
| 150 EUR | 26 |
| 200 EUR | 23 |
| 250 EUR | 20 |
This is definitely not something that is out of reach, but this savings and investing discipline is not typical for an average person with average fiscal discipline. After all, all human beings are wired for instant gratification as opposed to disciplined behaviour to reap long-term benefits.
This only covers publicly traded companies. We discuss privately owned companies in the next two sections and demonstrate how accessibility and hedging make these unavailable for retail investors.
Accessibility
With residential real estate being (almost) transparently marketed, one can claim that access to this asset category is not an issue. With commercial real estate being available through funds, the same can be said about the other half of the real estate market. Similarly, access to publicly traded stock is not an issue. However, publicly listed companies represent only a fraction of the entire economy.
With 4,266 companies listed in the US stock market alone (2023 Q2), the choice is plenty, right? Again, not entirely so. Companies tend to list in stock exchanges later and later in their growth cycles, often leaving just a limited upside to the retail. Instead, companies acquire the growth capital from private investors.
And as a private investor, you really do not have access to the early-stage companies that can potentially offer 10x or even 100x+ returns on capital. Such access is limited to active angels and venture capitalists with large networks. As an average person, your access to the next Airbnb or Uber is next to non-existent, so retail is left with the limited financial upside available from public markets.
Is this necessarily bad? After all, later-stage companies carry less risk, so the limiting regulations and network-based access to early-stage investments surely works both ways?
The best answer can be received by examining the portfolio of one of the most prominent early-stage investors, Paul Graham, who has publicly disclosed that he has only two publicly traded investments in his portfolio - TSLA and AAPL. And even in these cases he was early - in the public domain he has stated that he initiated his position in AAPL in 2005 and in TSLA in 2015. One can only speculate on why, but the hypothesis for us is that he both rationally and emotionally is not associating himself with Large Corporations - the limited upside from the rational side and the lack of innovation in the same companies from the emotional side combined are manifested in investment decisions.
This brings us to the next topic - hedging
Hedging
Real estate is considered one of the safest investments. This has only been so with the relative calm on the planet over the last 75 years. The underlying risks of geopolitical or natural disasters are still there and real estate, especially if concentrated in a single location, is vulnerable to such events.
With publicly traded companies, one can hedge risks across sectors and geographies. With private and early stage investments, the picture is different. Let us take a look at the very same Paul Graham example. His investments in public markets are anything but hedged - having picked only two stocks, he is open to all risks related to the companies and sectors AAPL and TSLA are operating in. The flip side of the coin is his (undisclosed) stake in Y-Combinator, which he founded. Y-Combinator has invested in more than 3,000 startups across every (un)imaginable sector and geography. Having exposure to such a hedge makes bets in the public market irrelevant from the hedging perspective, as the Y-Combinator portfolio performance reflects both the pace of innovation and GDP growth.
If we now look at a retail investor who has accumulated initial capital and is considering investing in startups, he cannot really hedge the bets. The smallest investments in startups start from 10,000 EUR, so if a new angel has managed to save the capital and has exposure to some deals, he is bound to end up with just a few lottery tickets. If the newly minted angel investor is lucky, he will stumble upon the next unicorn, netting a life-changing return as a result. More likely than not, the investment(s) fail(s), and the lack of hedging means the person has lost the capital, and is back to square one.
Conclusions
The need to accumulate capital, access to certain asset classes and lack of hedging all pose significant burdens, especially for people in lower income buckets and/or at the start of their career. A good example of the problem is outlined by the His Majesty’s Revenue & Customs in UK Personal Income Statistics Report from 2020/2021:
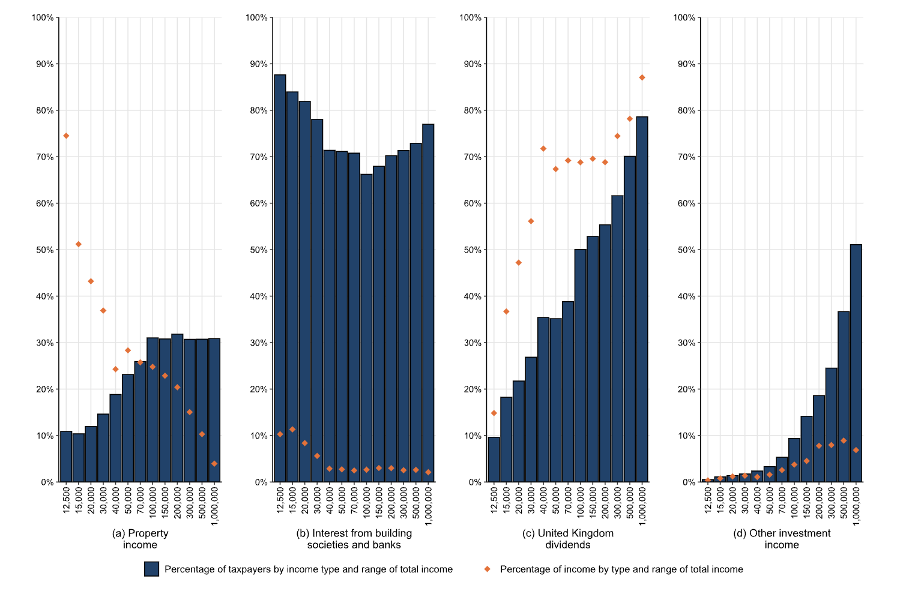
As evident above, the income buckets dictate the availability of assets, with lower income buckets earning next to no income from property, dividends and other income investments. Coupling this information with percentile points of total income for the last three tax years from the same report, the picture is even more grim:

According to the example above, the median taxpayer in the UK earns £28,300/yr or less and 90% of taxpayers earn £82,200/yr or less. Coupling this with the information in the income sources, we can derive that the median taxpayer has, for example:
- 11% likelihood of earning any income from property
- 27% likelihood of earning dividend income
- 2% likelihood of earning any other investment income
It clearly shows that capital gains are not working for the vast majority of society even in one of the most developed countries in the world.
Take-away
As the studies referenced above show, the impact of wealth concentration on our society is real. With access being limited to the financial instruments that are required to break out of the low-income trap, the future might hold nasty surprises for us.
Global trends amplify the impact, especially with jobs increasingly being divided by “above or below the API”. Either you tell computers what to do for a living or they tell you what to do. It is for our readers to determine which job category will reap the benefits of digitisation and whose job will be threatened with elimination by robots.
This divide might not get to “pitchforks are coming” in strong democracies, but do we really want a world where capital is being accumulated in the hands of a few wealthy people in Silicon Valley?
But enough of the whining - criticism is easy, being constructive and proposing a solution is more complex. In the following articles, we will outline what we believe might be part of the journey towards a more equitable world. As true believers, we put our money where our mouth is and try to bring this future to life. So stay tuned to hear how what we do in koos.io is linked to reducing income inequality in the world.


